Recording Tab
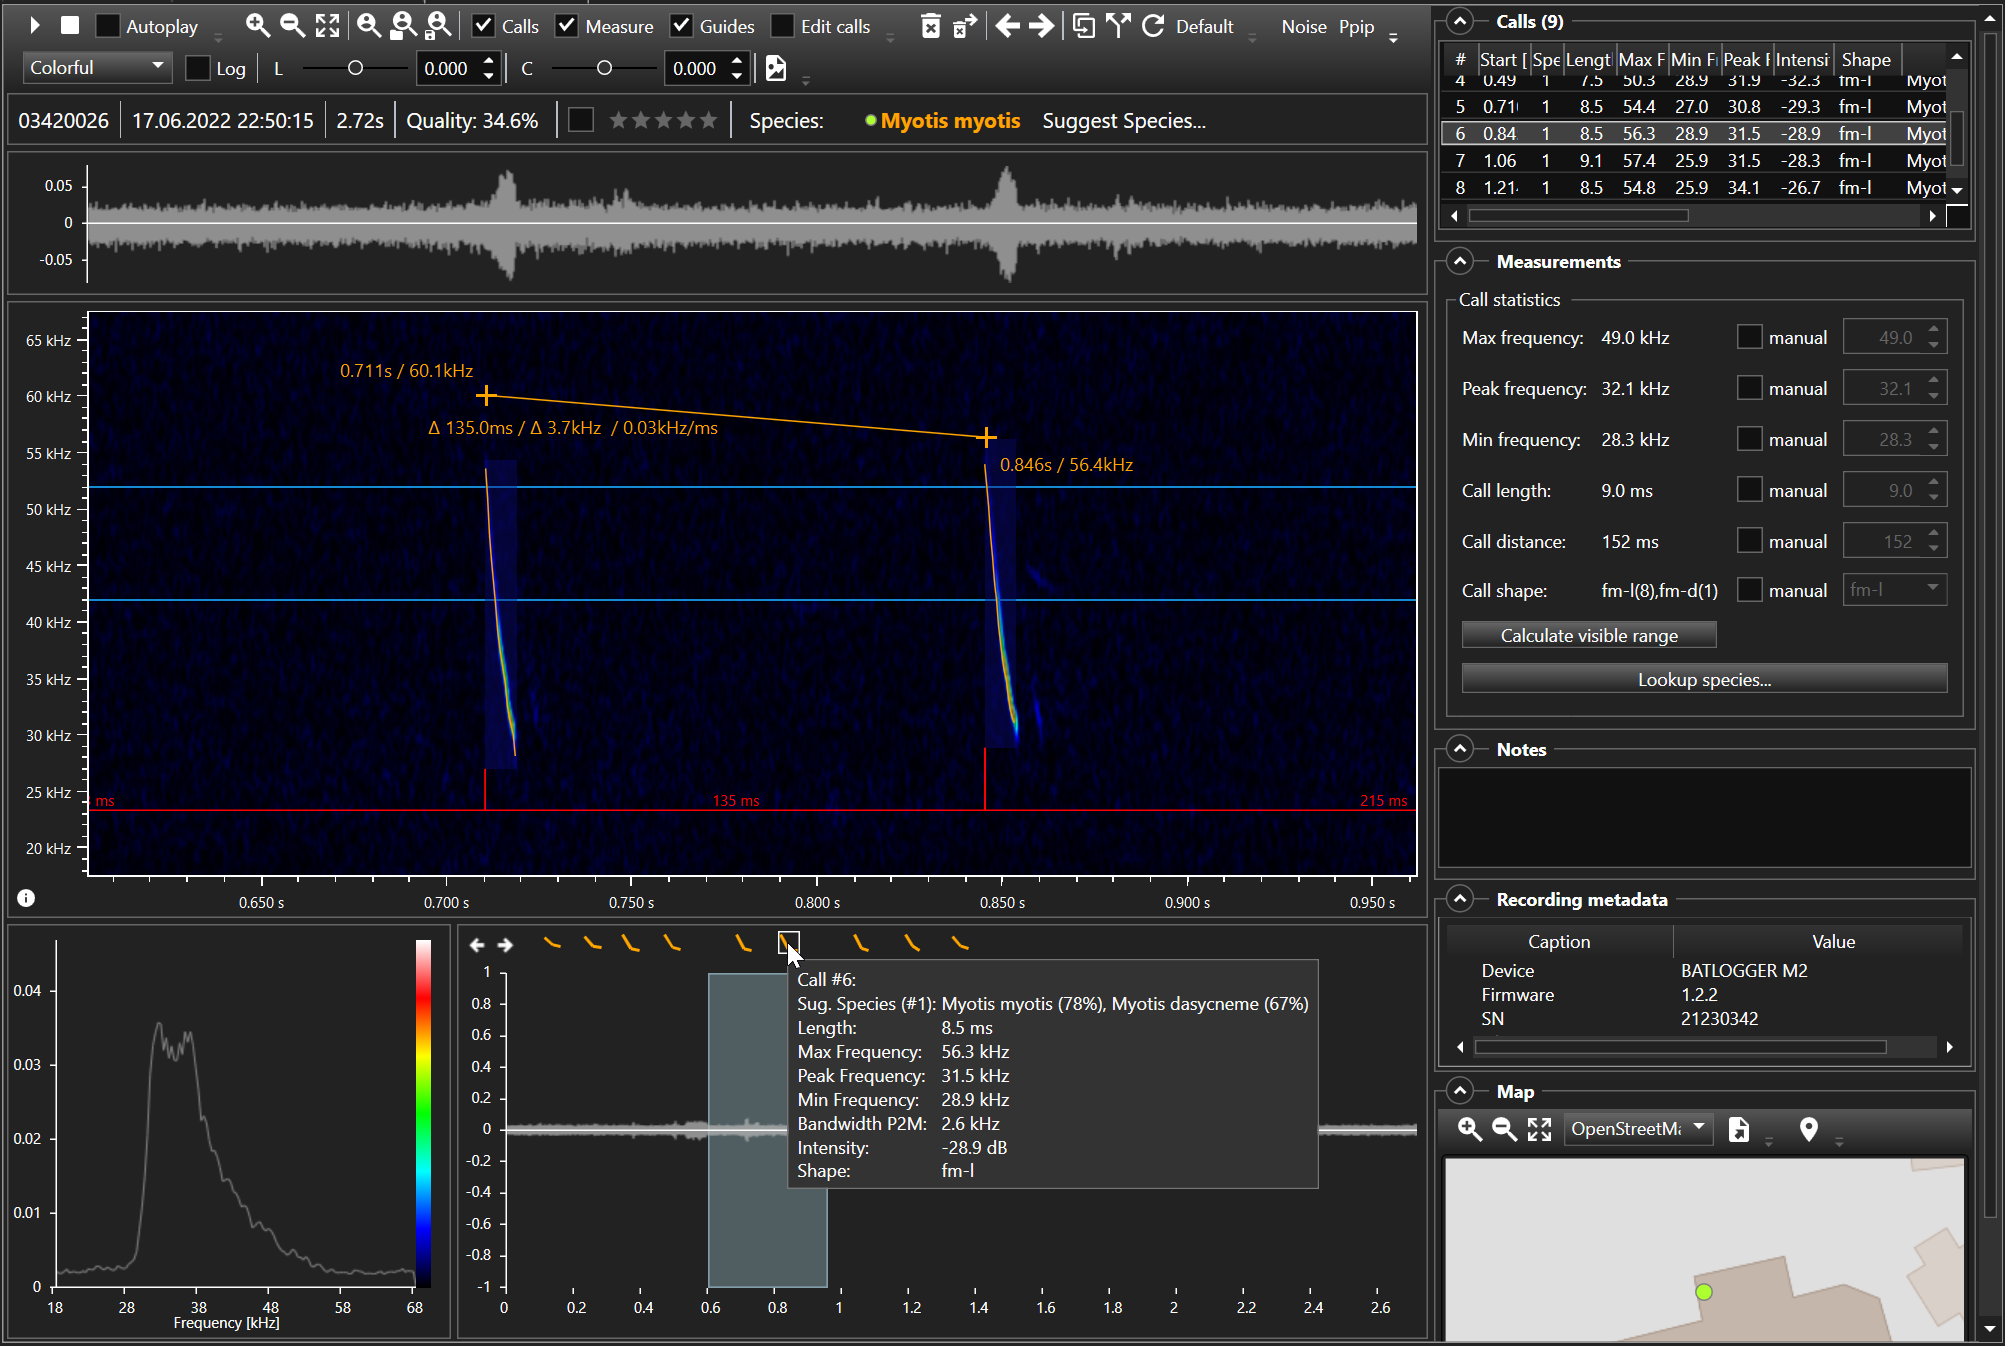
The Recording Tab displays a single recording. Various views and tools allow an in-depth analysis of the recording. Analyse a recording, measure call parameters and find the species.
It is possible to open multiple recordings each in a separate Recording tab.
Overview
Toolbars
The toolbar offers various tool functions to play, view and analyse the recording. Click a toolbar button to use a tool-function or change a view.
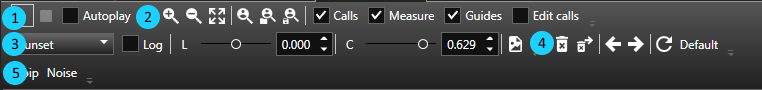
- 1 Playback
Play/Pause
Play: Starts playback from the play mark position or begining of the fileif not set.
Loop Play: Plays the marked play range in a loop.
Play visible range: Sets the play marks to the currently visible spectrogram part and plays it.
Loop Play visible range: Sets the play marks to the currently visible spectrogram part and plays it in a loop.
Pause: Pauses playback at current position to be resumed from there.
- Stop
Stops playback and resets position.
- Autoplay
If checked, the recording is played automatically after opening
- 2 View
Zoom in
Zoom out
Zoom all
Zoom to user settings view: Custom zoom ratio, see Options.
Restore view: Restore saved zoom ratio
Save current view: Save current zoom ratio
Show/Hide calls overlay
- Show/Hide calls shape points
Added in version v2.3.
Show/Hide measure overlay
Show/Hide guides overlay
- 3 Spectrogram
Colour palette
Log
Luminance
Contrast
Export spectrogram image
- 4 Tools
Delete recording
Delete recording and load next recording
Previous recording: Load the previous recording of the recordings list
Next recording: Load the next recording of the recordings list
Re-Analyse: Redo analysis, find calls and calculate call parameters. Use this to undo custom changes to calls.
Enable/Disable call edit: Manually adjust call shapes to improve species suggestions.
Default: Open recording with other application (e.g. Mediaplayer)
- 5 Instant species
Custom list of instant species buttons, see Project settings.
Recording attributes
The most important recording attributes:

- Recording
Recording name
- Recorded
Recording Timestamp
- Recording length
Duration of the recording in seconds
- Channel displayed (for multi-channel recordings)
The channel that is currently displayed
- Recording quality
Probability that the recording contains bat calls
- Mark
Check to mark recording for later filtering/processing etc.
- Rating
Star rating of this recording
- Species
Selected species or selection and suggestion list. If multiple species are detected, a warning is displayed, see Species classification
Tip
Hover the mouse cursor over the attributes to display additional information like sampling rate, location …
Views
The recording raw data (WAV-Data) can be displayed in different ways. Each way has its own strength when it comes to parameter measurements and species classification. The most important view for bat call analysis is the spectrogram view.
Tip
To export a view as image, right-click the view and choose Export to image. To export the spectrogram view, Click the toolbar button of use the menu File->Export->Spectrogram.
Spectrogram View
The spectrogram (aka sonogram, sonograph or waterfall) displays the frequency variations over time. It is used to identify animal calls, speech or other distinct signals.
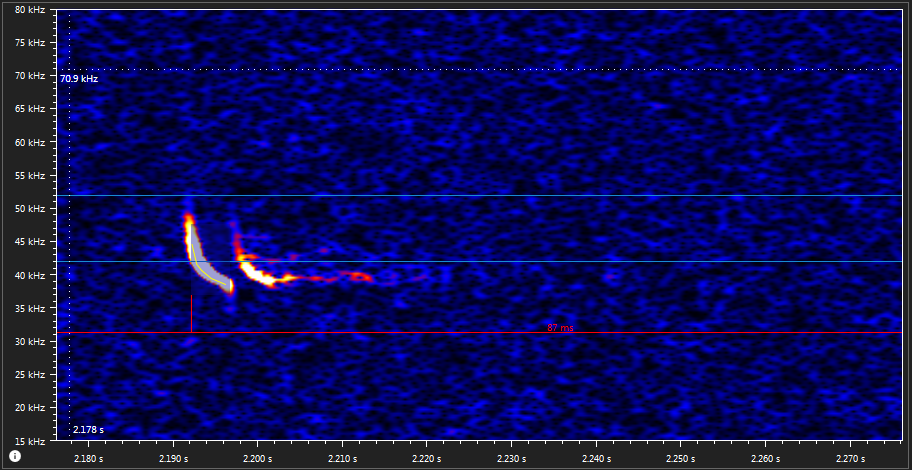
The spectrogram view can be adapted to your preferences. It can be zoomed and panned. The colour palette, luminance and contrast can be changed by using the corresponding toolbar functions.
To display a certain part of the recording only (e.g. a few calls), zoom the view by using the mousewheel or the + and - zoom buttons. Alternatively press and hold the Ctrl-key and draw a rectangle with the left mouse button down to zoom to that part.
Tip
To quickly display a single call only, select the call in the calls list.
When the left mouse button is pressed and held, the visible area can be moved. Additionally it can be zoomed also by using the mouse wheel over the axes, but then only in the appropriate direction. The full view is reached by double-clicking on the spectrogram or the Zoom all button in the toolbar.
Tip
Hover the mouse cursor over (i) icon to display additional information about zooming and spectrogram tools.
See Spectrogram tools for more information.
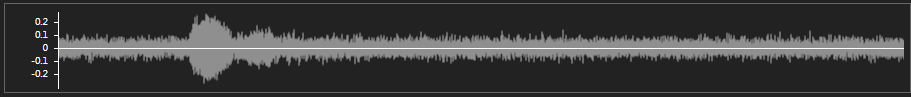
Waveform View
The waveform displays the signal amplitude variation over time.
The lower overview waveform always displays the whole recording. When zoomed, the zoomed part is indicated by a rectangle. To move the zoomed part, click on an other part of the overview waveform or press and move the rectangle.
The playback range can be set by left-clicking on the time-axis. Click to set the start position, Shift+Click to set the stop position. Green lines indicate the range.
Click Stop when playback is stoppend already to reset playback range.
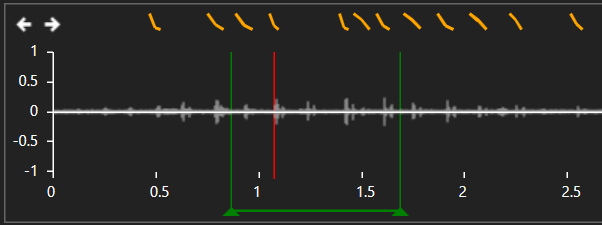
Bat call pictograms are display above the waveform at its timepoint. Click a pictogram to zoom to the respective call. Click the arrow buttons to go to the previous/next call. The pictograms can be hidden by changing the options.
The upper waveform view displays the zoomed part only. It is synchronized with the spectrogram view. To measure time, press the left mouse button and move the mouse to the right. A measurement rectangle is displayed together with the length of the rectangle in milliseconds.
Tip
Time measurements are best made in the waveform view. Time measurements in the spectrogram view may be inaccurate due to the nature of a spectrogram. A spectrogram is created by using time frames and calculating the spectrum for that frame. This leads to a limited time resolution.
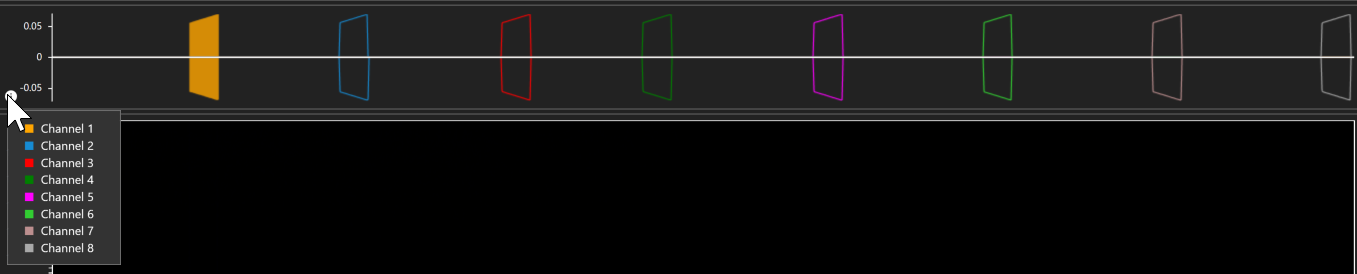
On multi-channel recordings, the waveforms of all channels are displayed in different colours.
Tip
To display the spectrogram of an other channel of a multi-channel recording (e.g. stereo), choose a channel from the menu Recording -> Switch channel or hover the mouse over the “displayed channel label” and check an other channel. Press Ctrl+T to quickly switch to the next channel.
Changed in version v2.3.
Spectrum View
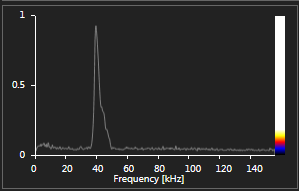
The spectrum view displays the mean spectrum of the visible part of the recording (time frame displayed in the spectrogram). It indicates the distribution and magnitudes of the frequencies contained in the signal. The colour scale shows the mapping to the magnitudes in the spectrogram view.
Tip
To zoom the frequency axis equal to the spectrogram view, enable “Zoom spectrum” in the Options.
Calls
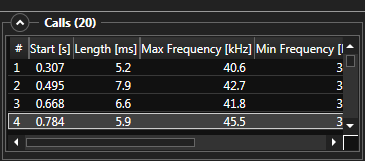
A list of all the calls of the recording and its parameters. Click (select) a call in the list to zoom to that call. Use the up/down arrow keys to quickly select the prev./next call. Multiple calls can be selected.
If multiple species are detected in the recording, the species number column shows the species number the call belongs to. See Species classification for more information.
Right-click to open the context menu:
- Show
Zoom to the call
- Delete
Delete the selected calls
- Select all
Select all call in the list
- Copy
Copy call parameters of selected calls as “comma separated values”. Paste it to a spreadsheet application (Excel) or text editor.
- Export
Export call parameters of selected calls as “comma separated values” file. See Export for more information.
Measurements
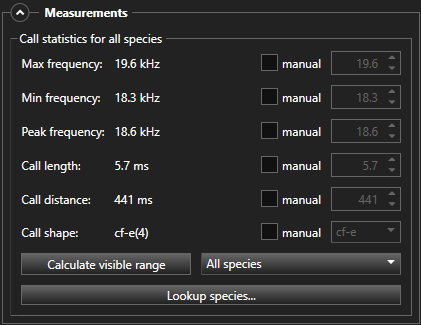
Call statistics
The parameters of all calls of the recording are summarized and displayed as average values. The mean call length and mean call distance values are not always real mean (average) values calculated as sum/count. If there are enough calls in the recording, the most frequent length is used instead (value with highest distribution). This reduces the influence of outliers and emphasizes the lengths that occur most often to get better species suggestions. The call shapes are counted and sorted after occurrence.
The statistics can be used to lookup species in the species library. Click Lookup species to open the species library dialog and set its filter with the statistics parameters.
To override a value, check manual and enter the new value. The override value will be used for species lookup then.
Click Calculate visible range to calculate statistics of the calls visible in the spectrogram only. Use this function if you only want to consider the “good” calls for example.
If the recording contains multiple species, you can choose to consider all calls or only the ones from a certain species. Select a species number from the dropdown list and the click Calculate visible range to recalculate statistics.
Experimental
Calls data can exported to be used by GraphB "Barataud" web tool for further statistical analysis. Use File -> Export -> Selected calls to GraphB… and then import the generated file into the GraphB tool.
Added in version v2.3.
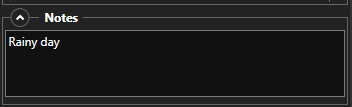
Notes
Add notes to your recordings for any additional information you want. The recordings can also be filtered, so one can add a note “ask colleague” and filter all the recordings that include this, to show all these files to a colleague.
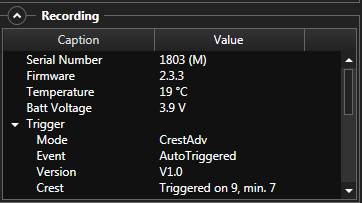
Recording metadata
Displays meta information stored with the recording like device used, trigger information, sensor data and the like. For BATLOGGER recordings, this is all the information stored in the recordings XML file, for others GUANO metadata.
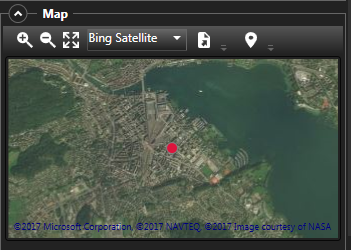
Map
Map with the recording location (if available).
To assign a new location, click the Assign location tool button.