Bat call parameters
For species identification usually the following call parameters are measured and compared with species-specific data. Mainly calls in search flight in obstacle-poor terrain are used. Hunting, social or search calls in obstacle-rich terrain often have different data and can cause confusion.
Main parameters
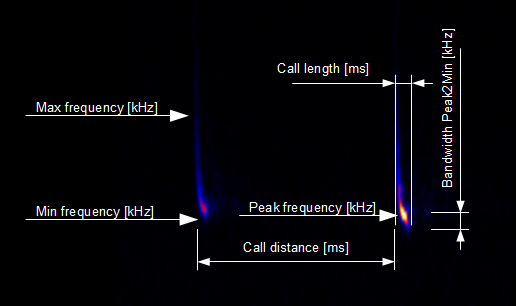
- Peak frequency [kHz]
- The frequency at which the call is loudest (peak in the spectrum display), aka frequency of maximum energy (FME) or main frequency.Most important parameter for bat classification because it can easily be measured and is often typical for a certain species or group of species.The standard deviation of the peak frequency allows the detection of alternating calling species.
- Max frequency [kHz]
- The maximum frequency of the call. Often this is equal to the start frequency, for Rhinolophidae typically equal to the peak frequency.
- Min frequency [kHz]
- The minimum frequency of the call. Often this is equal to the end frequency, for hockey stick calls (e.g. Pipistrelle) it might be lower than the end frequency.
- BW Peak2Min [kHz]
- Bandwidth Peak2Min = Peak frequency - Min frequencyOften used to distinguish Myotis and Pipistrelle calls, Myotis mostly have higher bandwidth.
- Call length [ms]
- Time period of call start to call end in ms. Can be measured most accurately in the oscillogram (wave rise to wave drop).Search calls from European bats are usually between one and up to approximately 30 ms (horseshoe bats up to 80 ms).
- Call distance [ms]
- Time period between two consecutive calls in ms. Can be measured most accurately in the oscillogram (wave rise call A to wave rise call B).Often this parameter is not very significant since most bat species have irregular rhythms. But it can be an indicator for behaviour.Search calls from European bats usually have distances of about 30 to 300 ms, sometimes even longer.
- Intensity [dB]
- Loudness of the calls peak point.Not relevant for species identification, but can be used to estimate signal quality or as a hint for bat distance to mic or movement.The lower the value, the quieter the signal. Values close or equal to 0 mean saturation or overloading of the signal and might hint to missing of some call features or inaccurate peak frequency detection.
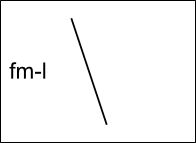
Call shape
Bat calls are usually evaluated in a temporal frequency response diagram (spectrogram). Thereby for bats typical shapes are formed which can be divided into the following groups:
Category |
Shape illustration |
Attributes |
|
|---|---|---|---|
Constant frequency |
exactly constant |
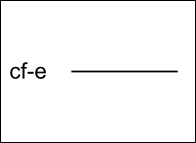
|
Exact constant frequency response Frequency difference between calls begin and end < approx. 2kHz |
nearly constant |
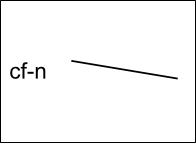
|
Nearly constant frequency response Frequency difference between calls begin and end approx. 2 .. 5kHz |
|
Frequency modulated |
linear |
|
Linear modulation (ft/dt) |
descending |
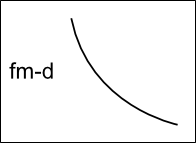
|
Descending modulation (ft/dt) Usually the frequency decreases, rarely increases |
|
ascending |
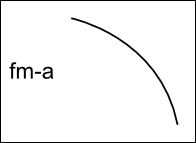
|
Ascending modulation (ft/dt) Usually the frequency decreases, rarely increases |